Transform Raw Data from mere Numbers into Actionable Insights.
A process of collecting, organizing, cleaning, and processing data to extract patterns, insights, relationships, and recommendations that support better decision-making. Its goal is to transform raw data from mere numbers into actionable insights
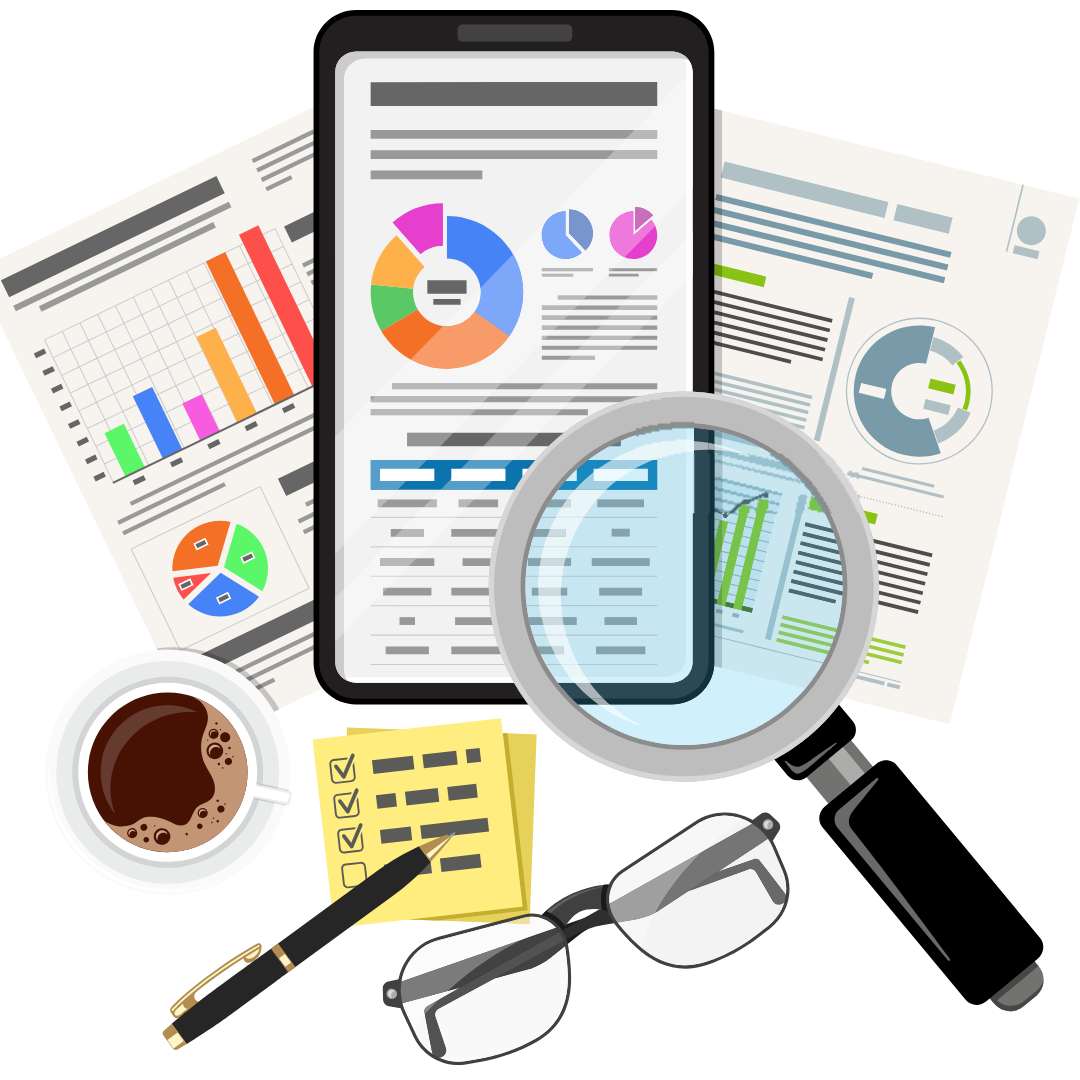

Benefits of Data Analytics in the Workplace
Data analysis contributes to improving performance and productivity in a number of ways, including:
 Making accurate and thoughtful decisions based on numbers rather than estimates.
- Increase the efficiency of teams by tracking and analyzing actual performance.
- Reduce errors and waste by catching issues early.
- Improve the customer experience by understanding their behavior and needs.
- Support strategic planning and intelligent resource allocation.
- Discover new opportunities for growth and expansion in markets.

Steps for correct activation of data analysis
To get the most out of data analysis, you need to follow methodical and deliberate steps:
 Determine the goal: What issue or decision are we looking for an answer to?
- Data collection: From reliable and up-to-date sources (systems, questionnaires, databases...).
- Data cleaning: Remove missing, erroneous, or duplicate values.
- Choosing the right tool: Based on the type of data and depth of analysis required.
- Data analysis: Using statistical, visual, or predictive techniques.
- Presentation of results: Through reports or dashboards that are easy to understand and interpret.
Expected results from analyzing the data
When data analytics is applied effectively, a range of positive outcomes can be achieved, including:

Significantly increase productivity.
by optimizing workflow and increasing employee efficiency.
Improving the quality of services and products through process optimization.
by understanding customer needs and optimizing processes accordingly.
Reduce operational costs and discover sources of waste.
by identifying unnecessary spending and optimizing the use of resources.
Support innovation by discovering new trends and opportunities.
by analyzing data to explore new areas of growth.
Enhance customer satisfaction and retention.
By offering personalized services that meet their expectations.
Achieve a competitive advantage in the market by making faster and smarter decisions.
By using data to make accurate and quick decisions.
Data Analysis Tools
Data analysis relies on a set of technical tools, which vary depending on the type of data, the size of the data, and the level of analysis required. Some of these tools include

Microsoft Excel / Google Sheets:
for simple and quick data analysis.
Power BI / Tableau:
Tools for visualizing data via interactive dashboards.
Python (libraries: pandas, numpy, matplotlib):
For advanced software analysis.
SQL:
To extract data from large databases.